Db2 as a Graph Database
18 April 2023
Dean Compher
Db2 Graph is a no-charge add-on tool that allows your applications or the included graph web interface to make graph queries on data stored in Db2. This is quite useful because when you need to visualize data in a graph you can do that, and when you need do SQL analytics queries you can do that on the same data. This tool makes it especially easy to visualize your existing db2 data in a graph. It has a web interface for specifying which data in the database you wish to graph as well as visualizing graphs based on the queries you submit. If you aren’t familiar with what graph databases do, trying the Db2 Graph tutorial is a great way to get started. Graph applications are an important tool in any analytics toolkit and having a basic understanding of them is important to any database professional.
Db2 Graph tool uses the Apache Tinkerpop graph analytics framework to process gremlin queries from a graph application or the included web interface, and then efficiently convert it to SQL that is submitted to Db2. The tool then returns the results back to the application submitting the gremlin query. One major use case for graph database is being able to see complex relationships in your data that you didn’t know existed. It is a very handy tool.
Figure 1. Components of Db2 Graph
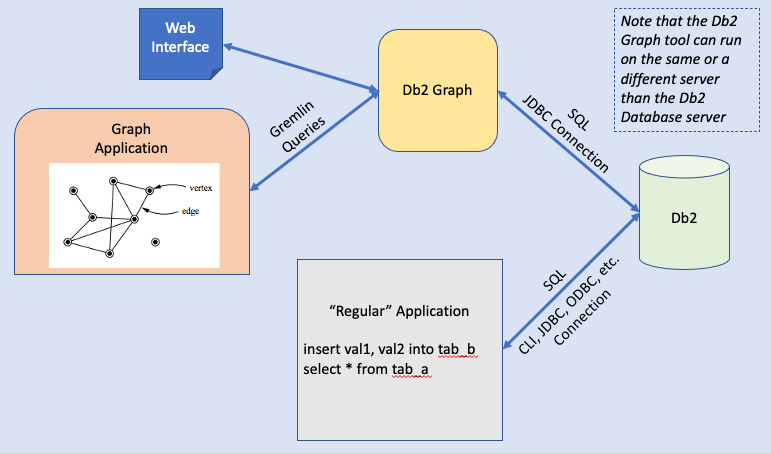
At a high level, Db2 graph works as follows:
1. Use the web interface of the Db2 Graph application and tell it which tables and views in the database you wish it to use to create the graph model.
2. After the model is created, you can execute graph queries.
3. At the same time, you can also continue to update and query the Db2 tables and views as you always have using SQL or Db2 utilities.
When creating the graph model from and existing schema or other set of tables in your database, edges will be automatically created using any foreign keys that may exist. If none exist or not all relations are defined that way, you can create edges manually. For a much better description of this and other aspects of Db2 Graph please review the IBM Db2 Graph Documentation page.
I think that the best way to get an understanding of the Db2 Graph tool is to install it and try the included tutorial. You can get Db2 Graph from the web, but first you will need to install a container runtime. I downloaded the free Podman container runtime on my Mac workstation. However, you can use any container runtime such as Docker. If you have a container runtime already up and running or have a Red Had OpenShift cluster, either of those would be a great place to put your Db2 Graph container. Once your container runtime is available you can pull and run the container as described in the Setting up Db2 Graph page. This page also has information about what you need to configure in your Db2 database such as required privileges.
The tutorial will add sample tables and other objects to your database that will be used for the lessons. The first lesson is the “Modern” graph. When you start the lesson, the tutorial creates the tables it needs in the database schema you enter and then the Db2 Graph tutorial creates the graph model from those tables automatically. The schema name you provide needs to be a schema name that doesn’t already exist and the database user must have create schema authority. This is only needed for the tutorials and not for production uses. The lesson starts with querying the graph. A later lesson will show you how to create a graph from a set of tables. I recommend using a tool such as the Db2 Management Console alongside the graph web interface that lets you see the tables and column names that the graph tutorial creates. This lets you compare the database objects with what you are seeing in the graph application.
Once you have tried the tutorial scenarios and have the hang of Db2 graph, I suggest pointing the graph application at an existing schema in your database that has foreign key references between the tables and see what the graph model looks like for it. You can then try some graph queries on your tables and see what interesting relationships might exist. As you will come to find out, the tables and views will tend to be shown as vertices and the foreign keys will tend to be shown as edges.
Installation and Container notes:
As I installed and examined the container, I learned a few things you might find interesting.
When creating the container, you specify a directory on the system hosting the graph container where persistent data for the container will be kept. Among data kept in this directory are log files, configuration information and graphs that you generate based on sets of objects in your database. This data is accessible from the host OS, but you probably should not edit that information. To view diagnostic information, you can review files in the “logs” subdirectory. Except for the tutorials, the db2graph application does not add or change any data in your Db2 database. It saves all information about graphs in the container’s persistent storage.
Since I installed it on my workstation, the initial configuration did not allocate enough resources to add a graph. When I tried to add a graph, the application hung for a while and then showed this error: "An error occurred attempting to create the graph Evaluation exceeded the configured 'evaluationTimeout' threshold of 600000 ms”. Information in the log indicated a problem with the gremlinPool setting. I increased it to 2 and I was able to run the tutorial. Here are the steps I followed:
Inside the Db2 Graph container:
1. Change to the /db2graph/gremlin directory
cd /db2graph/gremlin
2. Edit gremlin-server.yaml
3. Change the value of gremlinPool from 0 to 2 or greater
gremlinPool: 2
4. Restart the Db2 Graph server
manage restart
***
If you try Db2 Graph, please share anything interesting that you learn or problems you solve to my Facebook Page.