Data Studio Web Console
Dean Compher
27 April 2012
If you have been fantasizing about a free basic job scheduling and health monitoring tool for your DB2/LUW and DB2/zOS databases then your dreams have come true! You can now install the IBM Data Studio Web Console (DSWC) on a server somewhere in your environment to perform these functions. With the Job Manager part you can schedule scripts and jobs to run on the database server and define job dependencies so that jobs run in the correct order and will stop the stream if a problem occurs. This is a great replacement for the Task Center that has been deprecated. From there the Health Monitor part can monitor your database servers for basic health indicators like instance down, space problems and a number of other issues. You can also use it to view alert history, view and manage application connections and view the status of utilities. In this article I tell you about the architecture of the DSWC, how to get it and install it, while providing lots of good links.
The Data Studio Web Console is a process that runs on a server somewhere in your environment that runs jobs and monitors your DB2 Databases sending you alerts if it detects a problem. The DSWC also submits and monitors scripts and jobs on your databases as well. It does these things whether clients are connected to the DSCW or not. You can connect to it through a web browser or using the Data Studio Client from your workstation. Please see figure 1 for an example configuration:
Figure 1: DSWC Configuration
The DSWC does not have to be installed on its own server. It can be put on a workstation or on one of your database servers. The first thing that you need to do after installing the DSWC is to configure it to connect to the databases in your environment. Then you can optionally configure it to run jobs and monitor your databases sending you alerts when problems are detected like an instance crash. You can optionally use a DB2 database to hold information for the DSWC. The Installation and Configuration page contains links that tell you how to install the product as well as the system requirements such as operating systems on which it will run.
Job Manager
The Job Manager feature of the DSWC allows you to schedule jobs, scripts and job hierarchies that run on remote databases. This feature will replace the Task Center feature of the Control Center sometime in the future. You can use a web browser or the Data Studio Client to access the Job Manager to schedule jobs or view job history. It has no components that need to be installed on the remote servers, but does require a login to your database, the ability log into the remote database server using SSH, or both depending on the mix of operations that you wish to do. You can only execute SQL Scripts on DB2 for z/OS. The following table shows the three types of jobs that you can run and the type of access to the database server that you need:
|
Job Type |
Connection |
Example |
|
SQL Only Scripts |
Connect to DB |
select * from syscat.indexes; update col_a on table_27 where col_b = “Dean”; |
|
DB2 CLP Scripts |
SSH |
RUNSTATS on table table_27 EXPORT TO output.del of DEL select * from table_27 |
|
Shell Script or Executable |
SSH |
my_shell_script that contains commands like db2 connect to <Database>, db2ilist, etc… |
Individual jobs can be scheduled to run once or on some repeating basis. Further you can chain jobs together such that each job is dependent on successful completion of the previous job. Should a job fail then the subsequent jobs will not run if that is how you configured the chain. The Job Manager keeps a history of all jobs and their success or failure allowing you to drill down into individual runs to see what happened. Further you can make the Job Manager send you an e-mail based on the failure, success, or both when a job completes. It allows you to run the same job against different databases because it allows you to configure different user id’s for different database connections.
Health Monitor
The Data Studio Web Console Health Monitor allows you to monitor the health of your various DB2 environments. You can configure it to send e-mail or SNMP alerts when thresholds are crossed or databases fail. You can also view alerts and configure the monitoring from your favorite web browser or through the Data Studio Client. With a glance at the console you can see a high level status of all of your databases and drill down into individual databases to examine the details of any alert. You can also browse the history of alerts. Alerts include down systems, excessive tablespace consumption, and other important health and performance alerts. For all operating systems, you can view the status of running utilities and on z/OS you can see system log entries and view the current status of the data sharing members of your system. You can also view information about connected applications and force any applications that are causing trouble.
You can download the DSCW and the Data Studio Client for free from this link. There is also a free tutorial for Managing and scheduling database jobs with the web console.
Installation Notes
I wanted to try out the DSCW so I got access to two Linux servers. On one I installed DB2 and added some databases and on the other I installed the DSWC. I just followed the instructions in the Installation and Configuration instructions. I used the free TightVNC client get GUI access to my server and did the wizard driven install by executing the command “./DSWC.v3.1.install-on-linux-x86_64.bin”. This command will be slightly different for other operating systems. There is also a command line based install if you can’t get GUI access to your server. On the window where it asked what ports I wanted to use to allow connections I accepted the defaults of 11083 (HTTP), 11084 (HTTPS) and 11085 (Control). My server had pretty open access, but I highly recommend that you talk to your system administrator before you do your install and get agreement that he will open these or other ports. These ports are needed to allow you to connect to your DSWC process from your workstation. Once the install was done, I exited the process because I wanted to do the configuration from my browser session on my laptop. Also I didn’t want to put Adobe Flash Player on my server.
The next step was to configure DSCW to talk to my database. I found the configuration instructions to be somewhat unsatisfying, but I found that the configuration was quite intuitive. You can do the configuration through the Data Studio Client or a web browser. I thought that the browser to be more interesting so I used that. As the instructions indicated, I entered this address in my browser according to the document
http://10.67.19.229:11083/datatools
to start the configuration. You will substitute the IP address or host name of your server for the address shown here. When I did that I saw the following in my browser:

Since I wanted to keep a history of performance and health information, the first thing that I did was to click on the ”Select a repository database” in the Getting started section. I have already created an empty database for this purpose on my remote server and pointed to that one here. As with the Data Studio Client, the DSWC creates a JDBC type-4 connection to your database, so you don’t need to catalog any databases beforehand.
The next thing that I did was to add the two databases, SAMPLE and GSDB, that I had previously created to try monitoring and job submission. For this task I clicked the “Add database connections” link. Once I configured my database connections, I could see the following in my browser:

After clicking around in the browser interface looking at the health monitor and job scheduler, I wanted to try out the Data Studio client interface. I already have the Data Studio client on my workstation so I started it and set up my connection. From the main window, I clicked the following options starting with the “Window” option from the top of the screen:
Windows | Preferences | Data Management | Data Studio Web Console
which gave me this window shown below that I then completed.
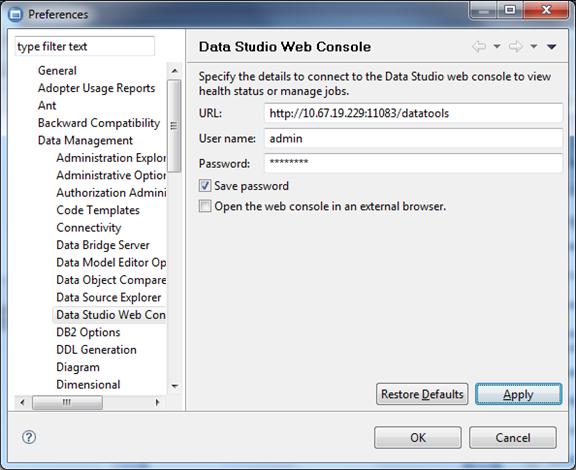
Once you have configured your Data Studio Client to connect to the DSWC, you are ready to use its features. It appears that the monitoring and job scheduling functions are imbedded in the Data Studio Client functions involved in those tasks. For example, in the script editor you can click the Job Manager (the little clock in the upper right corner) to schedule the script you just wrote. This is a very nice interface in that that the script editor in the Data Studio Client has lots of nice features for helping you with things like showing the columns of a table by clicking “ctrl-space” combo after completing the FROM clause in your select. Once the script is written you can click the Job Manager icon to schedule it. Another example is where you can right click on a database in the Administration Explorer and see the current Health Summary or view currently running applications. You can read more about how to use the Data Studio Client Interface to the DSCW.
***
I hope that this article has helped you understand what the Data Studio Web Console does, its basic architecture and how to get it installed. In a future article I hope to write about how to actually use it to monitor databases and schedule jobs. In the mean time if you start using it, please add any insights that you gain to my Facebook Page or my db2Dean and Friends Community.