Data Studio Update Part 6
Query Tuning for DB2 LUW and z/OS
Dean Compher
29 August 2013
In my Data Studio Update Part 5 I showed how to create queries and now I will describe how to tune those queries so that they run as fast as possible. Data Studio can be your GUI interface for Optim Query Workload Tuner, but it can also do some useful tuning on its own. Since this is an article on Data Studio, I will concentrate on the free features that are part of it. Once you have written your queries, it is a good idea to make sure that they will run efficiently if you are going to put them into a production application. To that end Data studio provides an easy way to see the queries in Visual Explain to view access paths and observe relative costs without leaving your query editing session. Data Studio query tuning will also format gnarly queries you copied from other places making them easy to read and it will also make recommendations on RUNSTATS options that will benefit the query and will summarize access plan and recommendations into a report.
Getting Started
Before you can start tuning any queries in Data Studio, someone must have created the explain tables on the database where you are executing the query and those explain tables must be for the version of DB2 that is currently running. Sometimes explain tables will have been created prior a database being upgraded and will therefore, will be out of date. To verify that every thing is in place for query tuning, please follow the steps in the Preparing for Tuning page in the Information Center. If anything is not ready follow the steps that page of the Info Center that gives quick instructions or you can follow the steps in chapter 7 of the Getting Started with Data Studio for DB2 e-Book that gives step by step instructions for configuring the database.
There are different ways to approach tuning your queries. One is where you are developing a query and want to format it and tune it as part of your development and the other is where you want to capture queries from the package cache or some other source and tune it there. In this article I will discuss tuning a query that you have in the SQL and XML Editor and talk about how to go looking for bad performing queries in your system in a later article. There are various ways to begin the tuning process of individual queries, but I share my favorite here.
Tuning Queries in the SQL and XQuery Editor
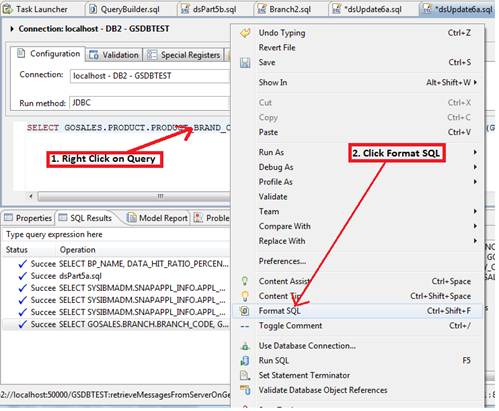
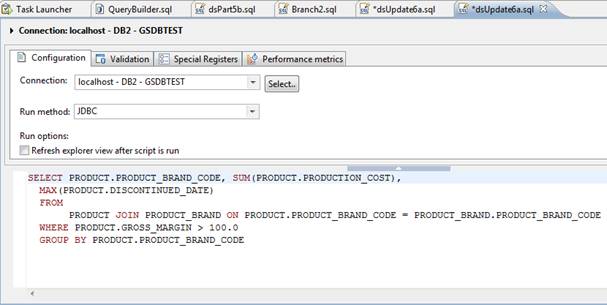
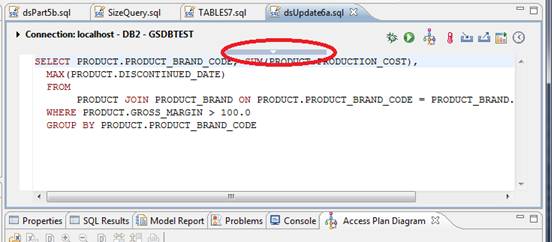
As I noted above, I will start by discussing how tune queries as part of the development of the query in the SQL and XML Editor discussed in Data Studio Update Part 5. Because of the way that you wrote the query or because you pasted a query from an unformatted source that someone e-mailed you your query will frequently be all on one line and difficult to read. To format it, you just right click on the SQL statement and choose Format SQL from the pop-up menu as shown on the left side of Figure 1 and you will get a statement that looks like the picture on the right. Formatting the query is not required, but I find it helpful to examine my query before doing anything else.
Figure 1. Format your SQL Statement.
![]()
![]()
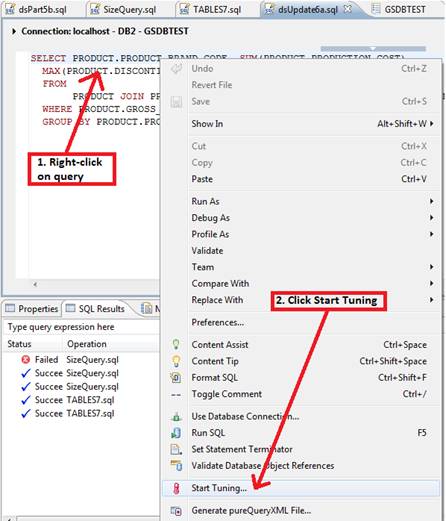
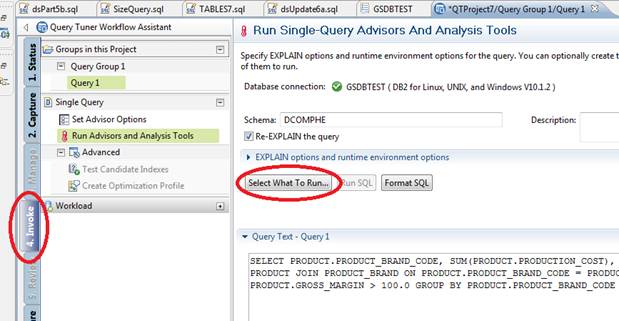
After you format your query, you will still be in the SQL and XML Editor. Following the pattern I have established in previous articles, I will start this from the Database Administration perspective, but you are free to tune from other perspectives as well. To begin tuning your query right click anywhere in the query and choose the “Start Tuning” option from the menu as shown in Figure 2. The Query Tuner Workflow Assistant will be opened with your query text in it. Notice that the “4. Invoke” tab (circled in red) on the left side is selected since you are already working on a query. Also make sure that the Schma is set to your desired schema before proceeding. The Schema box is above the “Select What to Run…” button. In my copy of Data Studio, the Schema changed from what I had specified in the default in the SQL and XQuery Editor.
Figure 2. Start Tuning.
![]()
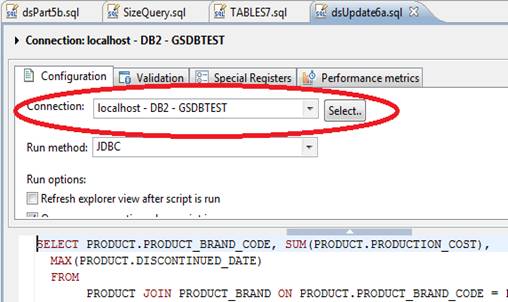
If after choosing the Start Tuning option, you are presented with a list of databases that does not include one you want, then you need to update the Connection Configuration for the query. To update that, expand the Query parameters box by clicking the little down arrow at the top of the query box as shown in the red circle on the left side of Figure 2a. You then select the correct connection in the Configuration tab and then start the “Start Tuning” process over again.
Figure 2a. Get Full List of Databases
![]()
![]()
To actually start tuning the query you need to tell Data Studio what to do by clicking the “Select What to Run…” button that is shown in Figure 2 circled in red. If you want to see the effects of changing things like the isolation level or query optimization level, you can do those things by expanding that “EXPLAIN options and runtime environment options” that is immediately above the “Select What to Run…” button.
Figure 3. Select tuning actions.
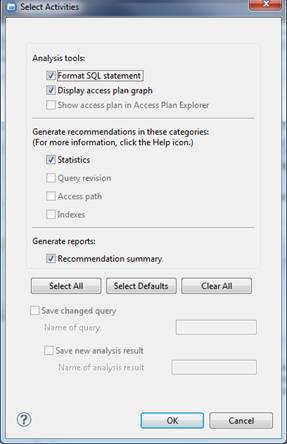
Clicking the “Select What to Run” button brings up the “Select Action” dialog box that allows you to check the boxes for what you want to do. I recommend just clicking the “Select All” button to check all boxes unless you have some reason not to run certain actions. You will notice that several of the boxes are greyed-out. This is because I do not have Optim Query Workload Tuner (OQWT) licensed for the database (GSDBTEST) to which I am connected. OQWT is part of the DB2 Advanced editions and is a great tool that can do some very good work to tune sets of queries in a workload.
As you can see the actions that Data Studio can do are:
- It formats the SQL so that it can be easily read.
- It will review the SQL statement and current statistics and generate a RUNSTATS command that may help this query run faster. While you may have recently run the utility, there are many options for the RUNSTATS command. This tuning action will create a statement that gathers all statistics that could improve the performance of this query.
- It Shows the Access Plan Graph. It is very similar to Visual Explain and lets you click on each step of the access plan to get details about the tables, sorts, indexes etc.
- It can create a recommendations summary report where you can see everything in one place.
Press the OK button on the Select Action dialog to begin the process. This can take some time and when it is done, you will see the recommendations as shown in Figure 4.
Figure 4. Tuning Recommendations
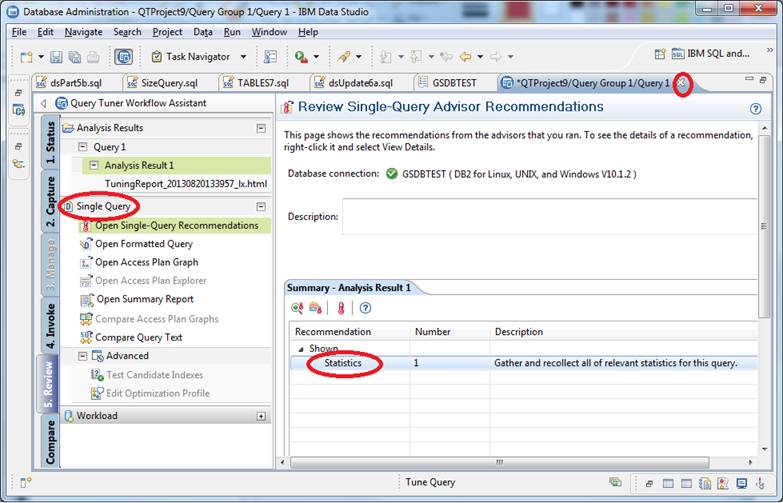 The details of the query tuning process will be in the Single
Query box that is about in the middle of the left pane of the Data Studio
Window. This will have all of the actions that Data Studio
performed. You can click each category to see the information.
The details of the query tuning process will be in the Single
Query box that is about in the middle of the left pane of the Data Studio
Window. This will have all of the actions that Data Studio
performed. You can click each category to see the information.
Click the Open Single-Query Recommendations to see the recommendations. Since the only recommendations that Data Studio does when you don’t have OQWT is to recommend new RUNSTATS, you only see “Statistics” on the right side. Then just double click the word “Statistics” (circled in red) to see the recommended RUNSTATS command. You can then copy the command to run later, or just execute it from Data Studio. If you are going to use the new RUNSTATS command then the curren access plan graph is may not be all that useful because it is likely to be different with new statistics.
You can also see the formatted query by clicking the Open Formatted Query in the Single Query box.
See the access graph plan by clicking the Open Access Plan Graph in the Single Query box on the left. This is very similar to Visual Explain
When you are done you can close and save the project by clicking the X in the tuning tab. I have circled this to highlight it. You will then be given a dialog box where you can change the name of the tuning session. This will create a new project. This is useful, if you want to compare the Access Plan Graphs before and after you have run the new RUNSTATS command. To see the project you saved in the Project Explorer, you must be in the “IBM Query Tuning” perspective. For more information about perspectives see my Data Studio Update Part 2 article.
To see the access plan graph click that option in the Single Query Box as shown in Figure 5. You can then begin clicking on the various boxes to get detailed information about each step in the plan.
Figure 5. Access Plan Graph
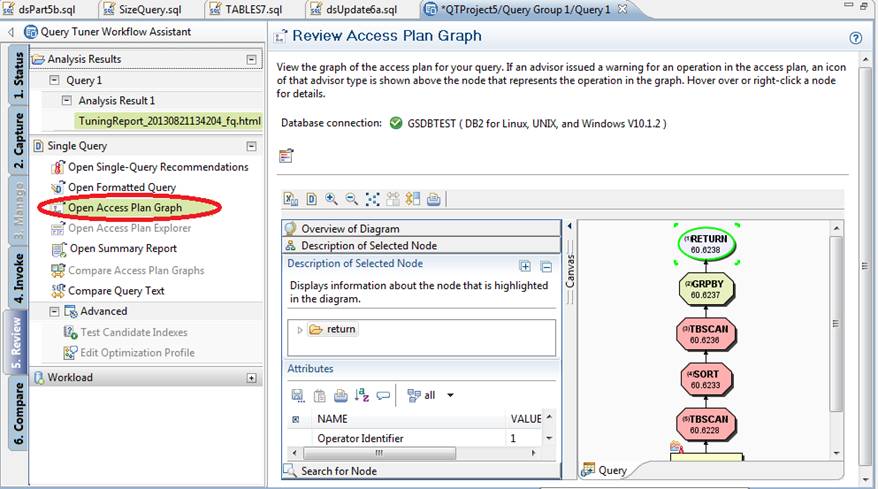
To see all of this information with plenty of additional detail, click on the Tuning Report option in the Analysis Results box on the upper left side of the window. If at any time you want to see your other views such as your Administration Explorer, just double click the query tab near the top of the window, in this case the “*QTProject7/Query Group…” in Figure 5. The tuning wizard will then just appear as a tab in the window. To bring it back into full screen mode, just double click it again. If you just want to see the query plan, you can choose the Open Visual Explain from the query editor too.
Figure 6. Open a saved Tuning Project.
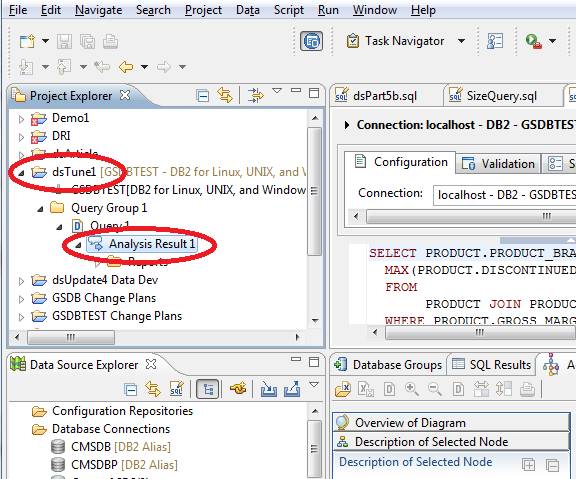 As I noted in the text describing Figure 4, when you close
a tuning session you can save it as a new project. However, unless you
are in the IBM Query Tuning perspective, you will not see your tuning projects in
the Data Project Explorer. However, once you switch to the tuning
perspective, you can see your tuning projects. To open the window that
has the choices described above in figures 4 and 5, you will want to open the
project, and then double-click the “Analysis Result1”. I have circled
these options in figure 6. When you do that you will be back in the
window shown in figure 4.
As I noted in the text describing Figure 4, when you close
a tuning session you can save it as a new project. However, unless you
are in the IBM Query Tuning perspective, you will not see your tuning projects in
the Data Project Explorer. However, once you switch to the tuning
perspective, you can see your tuning projects. To open the window that
has the choices described above in figures 4 and 5, you will want to open the
project, and then double-click the “Analysis Result1”. I have circled
these options in figure 6. When you do that you will be back in the
window shown in figure 4.
Here’s another interesting item. If you just want to do the visual explain without doing the other steps from the SQL and XML Editor, you can just right click on the query and select the “Open Visual Explain” at the bottom of the menu. This is just like what was shown in Figure 1, except that you choose the Open Visual Explain option instead of the Start Tuning option.
As I noted earlier, it is often best to tune DB2 for a set of Queries than for one particular query to get the best overall performance for your database. In addition to allowing you to tune individual queries Option Query Workload Tuner (OQWT) can recommend things like the indexes or other objects that would improve the overall performance of a set of queries that typically run together. It is typically better to optimize your database for a workload than trying to optimize several individual queries individually. For more information about Optim Query Workload Tuner, please follow these links:
You should note that Data Studio Version of 4.1 has been released that supports the new features of DB2 10.5 including BLU acceleration. It also has more tools to configure the ssh server that comes with DB2/LUW. You can download the New Version of Data Studio at no additional charge.
This is the Forth in series of Data Studio Articles that I am writing. Earlier editions that may interest you include:
Data Studio Update Part 1 – Links for installing, summary of my favorite features
Data Studio Update Part 2: Perspectives, Views and Database Connections – Navigating Data Studio, connecting to your databases.
Data Studio Update Part 3: View DB Objects and Attributes – View tables, columns, indexes and model diagram.
Data Studio Update Part 4: Changing Database Objects – Generate changes that preserve data and objects.
Data Studio Update Part 5: Query Building and Editing – Ways to create and edit queries in Data Studio.
Data Studio Update Part 7: Find and Tune Bad Queries from the Package Cache – Find bad queries in the package
***
There are many more things that you can use the default tuning features of Data Studio and I suggest that you take some time to explore them. Please take a view minutes to click around and see what is available. Please add any features that you really like to my Facebook Page or my db2Dean and Friends Community and help the extended community.