Using Various Data
Dean Compher
29 April 2017
Why is the availability of lots of new data interesting? You are probably sick of hearing about how so much data is being generated from all sorts of sources, but the fact is that a portion of this newly available data could be useful to you. There is a proliferation of data that is easy to get over the internet that is either free or available through paid subscriptions. It is at least worth some time to do some searching to see what is available that might benefit you. There is so much out there that it is quite likely that there are multiple sources that would be useful to your business. Further, with the proliferation of cloud tools it is quite easy to get your hands on some of this data to quickly examine which of the available data is actually useful. These tools also allow you to copy a transformed subset that data to your internal databases or copy your internal data to the cloud. In this article I will talk about how to get this data in a format that is useful to you.
As I noted in earlier articles, it is pretty easy to gather data from APIs from a variety of public and private sources into your relational database and in this article I’ll discuss ways to prepare and use that data to your benefit. One of the more useful things you can do is to combine data from a variety of sources including external sources and your own internal databases for various analysis. Because this data may come from lots of different places you will probably need to massage the data so I’ll discuss that as well. As a matter of fact, most analytics professionals spend more time getting their data in a form that is useful for analysis than actually analyzing it.
What sorts of things can you do with this data?
- You may be able to find patterns in the data that preceded good or bad events that are of interest to your organization and then look for those patterns developing. One example is where certain traffic patterns that can be predicted correspond to whether people are on time for appointments with your organization.
- There are also many other ways this data may enhance your Business Intelligence (BI) analytical processes.
- The data might just be useful to display along with your usual data on screens or reports. For example, it might be useful to show the weather in the caller’s area to a customer service representative. Everybody likes to talk about the weather.
How do you get this data? There are a variety of ways, but the main ones are just files that can be download and APIs that you can call. An API is just a remote process that you can call to do various things including querying data and updating data. Many APIs are available to be called over the public internet. Your organization probably has internal APIs that can be called as well. With files that you receive you will likely need establish a process to load them into a database that can be queried by your applications. APIs can be called directly by your applications or you can call them and add their data into a database that is queried by a variety of applications or BI systems.
I will now illustrate some of the processes you may need to do to use the external data and discuss various topics that these steps indicate. In my example I gathered a few months of weather observations from a weather API along with production data from the solar system on my house and then run some analytics to see if the analytics can figure out the obvious -- that the weather impacts solar production.
The first thing that I did was to begin collecting data. I created a script that called both the IBM Weather Company API to provide the past 24 hours of hourly weather observations and the API to get the previous 24 hours of hourly energy production of my data. My assumption was that there should be a correlation between the weather and how much energy my system produces during any given hour. This script then inserted the hourly weather and energy readings into a Cloudant JSON document store. After some data was gathered, I told Cloudant to start replicating the data into a dashDB relational database. By an easy review of the data, I could see that some manipulation was needed and finally pointed Watson Analytics at the dashDB data to see if it could find any patterns. It did, and I will now walk you through these steps in more detail.
To gather the data from these completely separate systems I set up a script on my laptop that ran every day that called the APIs and inserted the data. I used cURL to call them and cURL to put the data into Cloudant. Both of these APIs returned data in JSON format. While different APIs return data in various formats including delimited files and XML, JSON is a popular format supported by many APIs. You can see the details of how I deployed the Weather Company data service and used cURL to call the the service’s API in my Put the Weather in your Databases article. Further, this article explains how to deploy the Cloudant and dashDB services, how to put the data from the API into Cloudant and how to invoke the replication from the JSON documents in Cloudant to the relational dashDB. You can get a copy of my script, with the API key and user/password info altered, at this link.
These same operations could have been implemented using the Node-Red service in the IBM Bluemix portal. This is useful if you prefer to keep everything on the cloud. In my API Data in your Database article I show how to deploy the various cloud services needed, how to call both the weather and solar APIs and how to get that data into dashDB through Cloudant , all without doing any scripting. However, I do not show how to manipulate the timestamp passed to the Solar API in my Node-Red example.
In my case the purpose of getting these two disparate data sets together was to analyze them together. This meant that some manipulation of the data was in order. This is probably unavoidable in most cases. In the following paragraphs I will describe the data shaping that I did for this example just to show a few things that you may also need to do.
After creating my dashDB warehouse from the Cloudant data as described in the articles above, I could see that there were some errors in the data replication due to some data not conforming to the data types chosen by the replication process. In my case there were a few numeric fields that contained non-numeric data. So I the replication process that those fields should VARCHAR through the Cloudant Warehous facility and reinitialized replication. This is described in the link for starting the warehouse replication link in the articles referenced above.
Once I had a significant amount of data replicated into my weather and solar tables I wanted to analyze the data using Watson Analytics. I knew from previous experience that you need to join data if the data is in more than one table. The join can be accomplished by pointing Watson Analytics at the individual tables and then defining the join within the service or by creating a view in the database that joins the two tables. WA can see views. Since my background is in databases I chose to create a view. Either way I needed to determine how to join each hour’s weather observation with that hour’s solar production. There was a table for each of these, but the solar data was in one timestamp format (YYYY-MM-DD HH:MM:SS.N) and the weather observation timestamp was in the POSIX format (number of seconds since 1970) and in the UTC time zone.
So my first step was to create a view on each table that put the recirded timestamps into a DB2 timestamp format in the same time zone. Here are is a portion of the DDL of each. You can see the full DDL of the tables and views in this link.
-- Solar production view
CREATE VIEW WH_HOURLY
(ARRAY_INDEX, READING_TIMESTAMP, WATT_HOURS, SOURCE_ID)
AS
SELECT ARRAY_INDEX, TIMESTAMP(DATE), VALUE, "_ID"
FROM TWC_ENERGY_VALUES;
-- Weather Observations view
CREATE VIEW WEATHER_OBSERVATIONS
(OBSERATION_TIME, ARRAY_INDEX, CLASS, CLDS, DAY_IND, … )
AS
SELECT (TIMESTAMP('1970-01-01', '00:00:00')
+ VALID_TIME_GMT SECONDS) -7 HOURS,
ARRAY_INDEX, CLASS, CLDS, DAY_IND, …
FROM TWC_OBSERVATIONS;
Next I created a view in dashDB to join the tables and use all of the columns of both. Here is part of that view:
CREATE VIEW ENERGY_WEATHER"
(E_ARRAY_INDEX,READING_TIMESTAMP, WATT_HOURS, …)
AS
SELECT E.ARRAY_INDEX, READING_TIMESTAMP, WATT_HOURS, …
FROM WEATHER_OBSERVATIONS W, WH_HOURLY E
WHERE DATE(E.READING_TIMESTAMP) = DATE(W.OBSERATION_TIME)
AND HOUR(E.READING_TIMESTAMP) = HOUR(W.OBSERATION_TIME);
I then tried some analysis of the data but I noticed something odd. Night time readings of my watt hours readings were a mix of zeros and nulls. So I just updated my energy production table to change all of the nulls to 0 and that seemed to give me better results.
Once I had a single view of all of my data I was ready to do some analytics on it. I chose to use Watson Analytics. The reason I use it is because it easy to use and it can look for patterns in the data. If you are going to analyze your data, then Watson Analytics is a good choice for exploring it, but you can use any tool you like including SQL. You can get a free trial of Watson Analytics if you want to try it Regardless of the tool you use, you will likely have to help it by determining how the various data is related and helping the tool join the various files/tables.
As with any analytics tool, I had to first configure the connection to my dashDB database. It was easy to figure out how to connect to databases by following the instructions in the help documentation. I then selected the view I created and let Watson Analytics import the data. One nice thing about WA is that it does some preliminary examination of the data and proposes things you might want to review. Fortunately for me, one things it proposed was the question, “What drives WATT_HOURS?” That is what I really wanted to know so I clicked on it and got the following:
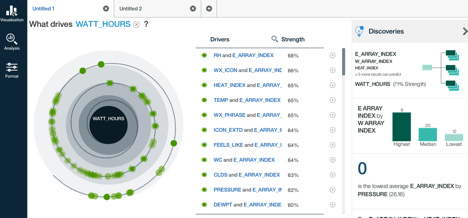
Before starting this, I thought that UV_INDEX would be the best predictor of energy produced (WATT_HOURS). Interestingly RH (relative humidity) and E_ARRAY_INDEX are the best predictors. E_ARRAY_INDEX is a number that corresponds to the hour of the day, so that makes sense that it is part of several predictions for energy as you can see from the chart above. Thinking about this it makes a lot of sense since there is no production at night and during the day the angle of the sun is important and that is related to the time of day.
While this was a really simple example of combining data from multiple sources it highlights a number of aspects of using various sources of data. Included in this list is the need for significant data preparation in almost any situation, the fact that data is available from many sources and you need to think about how those sources may have their deficiencies. One deficiency in my case is that the weather station used by my weather API call is about 20 miles from my house. I’m sure that sometimes it is cloudy at one location and not the other. One of these days, I’m going to get one of those home weather stations that can send data to your PC or a web site that you can call with an API. That would likely improve the accuracy of my data.
***
If you’ve found some interesting data or ways to use it, please share that on my Facebook Page or my db2Dean and Friends Community along with any other comments you may have.