Big Data - Why do I care?
Dean Compher
31 July 2015
If you are reading any IT industry articles these days you can’t help but see lots of discussions about Big Data and Analytics. But to many people there seems to be a disconnect between what they are doing in their shop and what they are reading because they don’t see anything being done with big data. Most IT people see the systems that they are maintaining and the projects coming down the road to improve these systems and build or modify systems for the business users. Some of these systems are even data warehouses where analysis is being done and reports are keeping the organization humming along. So why do I care about this Big Data stuff?
The answer has to do with the fact that much larger volumes of data and many new types of data can now be economically stored and analyzed. So while it may seem that the volume of data that you are processing with your existing systems is growing fast, the volume that you could be analyzing is growing exponentially faster. This means that as time goes on you are actually processing a smaller and smaller proportion of data that it is possible to examine, leading to worse and worse decisions being made relative to those who are analyzing more data. You may be thinking that this only applies to enormous internet companies or those that use exotic types of data because the press tends to focus on impressive use cases, but almost every organization can realize major value from analyzing the right data. So even if your needs are more mundane than being able to predict the paths of icebergs, the analysis of big data will be important to you, and if your organization is not looking at how big data can improve their decision making then they should. Also a number of organizations create a specific group to experiment with Big Data without telling a lot of people, so your organization may be already doing it without your knowledge.
Generically, one of the major ways this done is to gather large amounts of data from as many sources as possible and put it in one place such as a Hadoop cluster. Then analysis tools are used explore the data and to determine patterns in the data that seem to precede either positive or negative circumstances. This information can then be used to put policies in place to increase the good outcomes or decrease the negative ones. Once these patterns are known, other analysis tools can be put in place to recognize these patterns as they occur so that so that action can be taken to in time to affect an outcome. The key is to enable the organization to store and analyze enough data in an economic way to identify the patterns and then to act on them. The description of a discovered pattern is frequently called a model and there are standard ways of creating a model that can be ingested directly by the analysis tools that watch the data from the various sources as it streams in to you.
Any organization that works with the public, either commercial or government, can benefit from using the analysis of big data to determine sentiment and predict behaviors by finding patterns and then acting as those patterns develop. One of the much hyped ways of doing this is by combining social media data with public records and internal databases of information about people to determine sentiment about products or services provided. This sort of analysis can be used to determine the sentiment of the public towards some new marketing campaign or proposed policy change. Another way of using this sort of data is to prevent fraud, including loan fraud, government benefits fraud, and insurance fraud. Frequently when individuals or organized groups begin to commit a fraudulent activity certain patterns may appear in transactions and possibly in social media. In this video, Infinity Property and Casualty Insurance describes how they used analytics to reduce claim fraud.
Walmart used the analysis of big data to determine what products sold out in their stores in areas where hurricanes were forecast. They already knew that demand for items such as drinking water and batteries increased, but they wanted to determine increased demand for non-obvious items too. When a hurricane is forecast for a particular area they send extra deliveries of the items likely to see increased demand to the stores in that area. This has been quite successful with Wal-Mart being able to increase profitability and better serve their communities by not running out of needed items before a storm. Interestingly one of those items that people buy more of before a storm is Strawberry Pop-Tarts.
When interacting with the public through call centers or other ways, it is helpful to know as much information about the person as possible and to display that information to the service person it as quickly as possible. This will often come from internal sources, but those sources are frequently scattered between different divisions of a company or agencies of a state. That data is frequently siloed and may even be in e-mail or other content systems, so the right data analytics tools are important to put all relevant data in the hands of the call center operator. By viewing this short video, see how the New York State Tax agency improved the income tax refund process by analyzing data from a variety of sources while at the same time improving the citizens’ experience when dealing with them and reducing costs at the same time. Their next step is to get a better picture of each customer and using all their interactions with the state.
While I have hinted that social media data may be considered exotic by some customers, it is within a much easier reach than many think. For example I was using Watson Analytics to do some research on a customer I was about visit and saw this graph that shows the number of tweets by day and sentiment for one of that company’s business units.
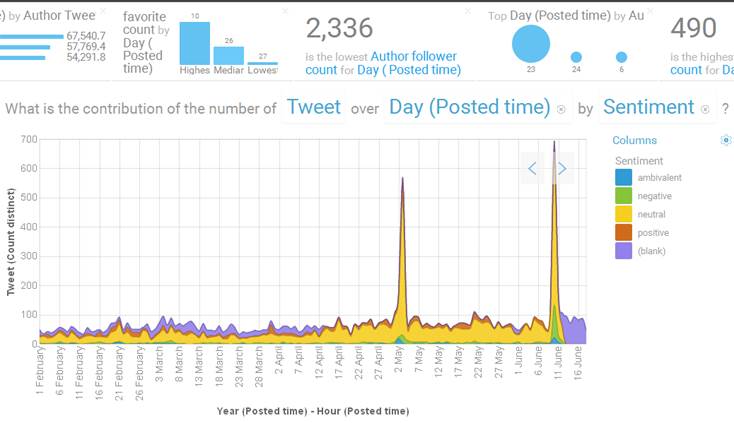
As you can see that customer had large spikes in the number of Twitter tweets around May 2 and April 10. A quick on line search allowed me to see that they had a large public event on one of those days and on the other there was a large news story about a similarly named place. Anyone who can afford about $80 per month can get this sort of data in minutes and with a larger investment can get even better analysis of these seemingly more exotic data and combine it with data from internal systems. Much of the work has already been done to allow the analysis of text and other non-relational data so you don’t need to develop it yourself. What could you do with information like this about your competitors or customers? What could this sort of information tell you about public response to your well-publicized events if you do not get a bump in the number of social media posts? Could your state agency benefit by knowing that there is an increase in social media posts and their sentiment regarding a service you provide? See a short case study of how a retailer used social media analysis to increase revenue in a particular product line.
Analysis of Big Data by large and small police organization across the country is becoming common place. While you may think that only the largest and most well-funded organizations like the New York Police Department are using Big Data to measurably reduce crime, smaller organizations are doing so as well. You can see how the Durahm, NC Police Department is doing it in this video.
Large and small health care organizations are used to collecting sensor data for measurements such as blood pressure, temperature, pulse, and oxygen levels, and taking action if any one of these are out of range. Some can even detect patterns collected from a range of sensors and can predict that an infection or other negative outcome is developing before any one of those measures goes out of bounds, but with more data there is even more that can be done. For example, about two weeks before the CDC knows that there is a flu outbreak from reports from health providers and states, those outbreaks can be detected by seeing the increased internet searches about flu symptoms and medications. Could these types of data be combined with what people are saying on social media, past patterns of disease outbreaks, health insurance data, and weather predictions to provide even more information and allow better prevention? It certainly seems so. Again, as I noted earlier big data is not just about using the more exotic data, sometimes it is just using the data that is scattered around the organization to get better care and outcomes as described in this video from Seattle Children’s Hospital.
Many organizations get mounds of data from sensors on roads, equipment, and devices, but only use it to help diagnose problems after something bad happens. However, this data can provide very useful information. Just like with other types of data you need to be able to economically store and analyze this data, and when you do you can find patterns that relate to both bad outcomes or ones that indicate that things are working as expected. These sorts of models allow you avoid problems caused by failures of equipment by seeing patterns that proceed a failure in time to do maintenance at a convenient time. It also allows you to do maintenance as needed instead of spending money to do it on a specified schedule that may have you doing unneeded maintenance. See how a contractor is doing just this in this video from Consolidated Contractors Group. You can also read about how Sao Paulo is making traffic better and safer using sensor data.
So now that you understand your organization needs to get started with the analysis of big data the next step is to determine how the get started. A great way is to contact your local IBM Analytics professional like me. We have programs for everyone from those who have no big data experienced to the advanced user.
***
One great way to find out about who is doing what in your area is to attend some meet-ups. Just go to Meetup.com and search for big data. For example there is a very active Big Data group in the Salt Lake City area and you can find their meetings on meetup.com. If you have any interesting stories about how you are using the analysis of big data, please share them on my Facebook Page or db2Dean and Friends Community.